install.packages("shinipsum")
I’m very happy to announce that {shinipsum} is now on CRAN!
{shinipsum} is a package that can help you build {shiny} prototypes faster by providing a series of functions that can generate random elements to populate your UI. If you are familiar with “lorem ipsum”, the fake text generator that is used in software design as a placeholder for text, the idea is the same: generating placeholders for Shiny outputs.
{shinipsum} can be installed from CRAN with:
You can install this package from GitHub with:
remotes::install_github("Thinkr-open/shinipsum")In this package, a series of functions that generates random placeholders. For example, random_ggplot() generates random {ggplot2} elements:
library(shinipsum)
library(ggplot2)random_ggplot() +
labs(title = "Random plot")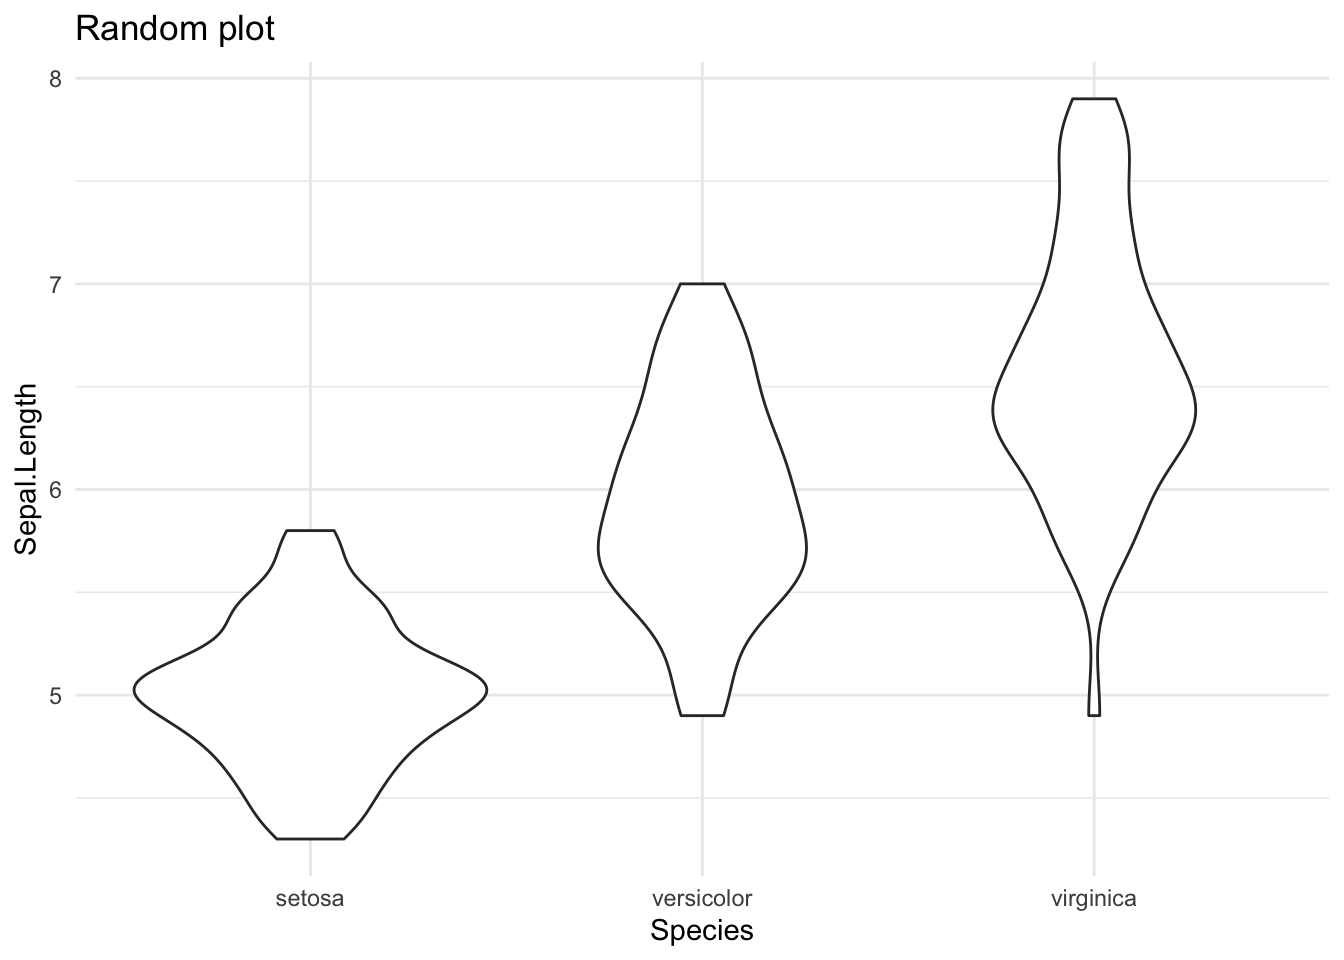
random_ggplot() +
  labs(title = "Random plot")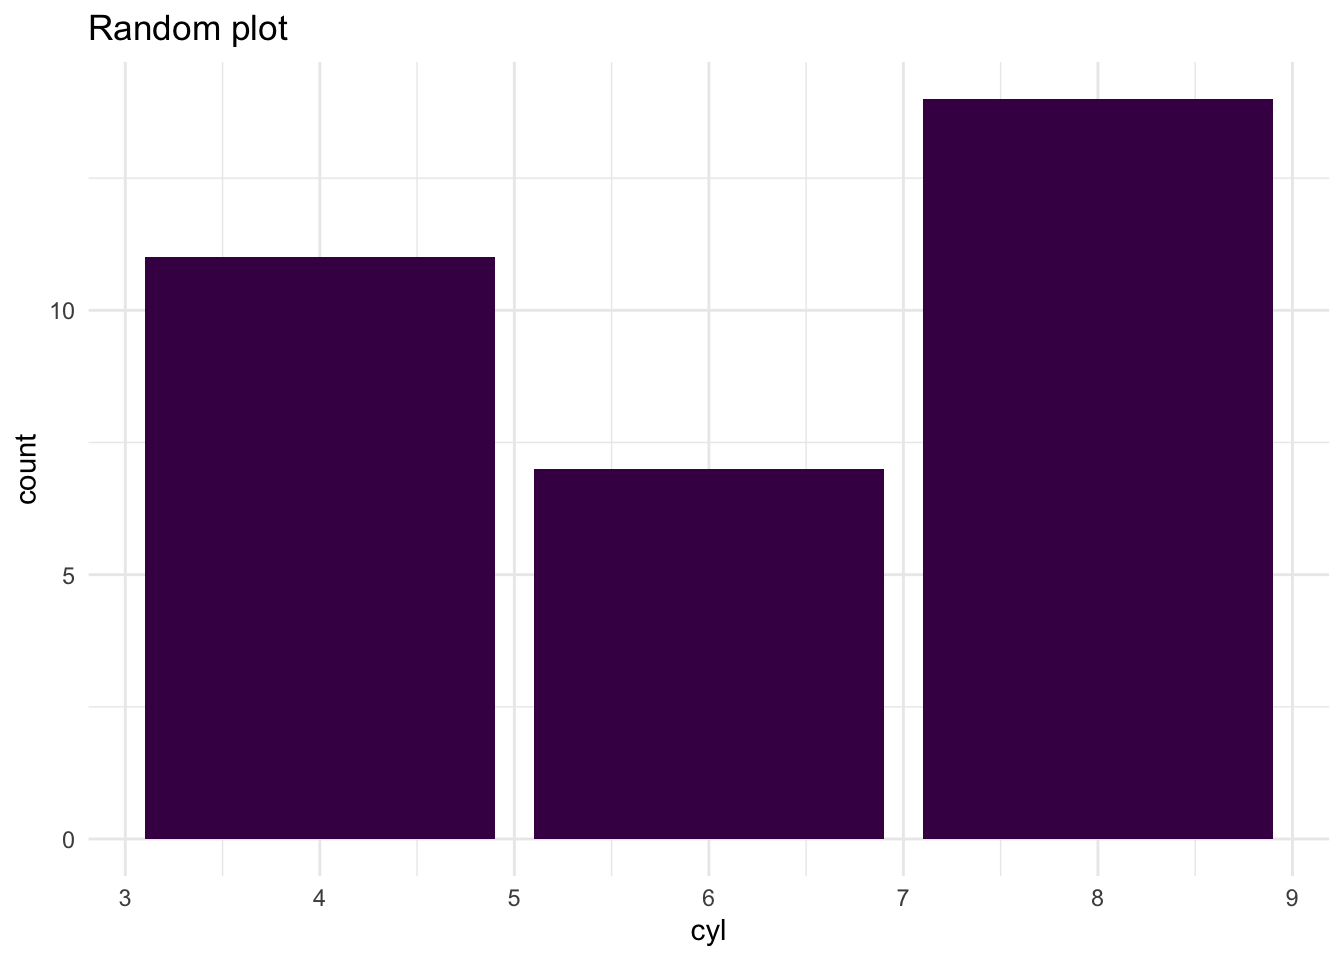
Of course, the idea is to combine this with a Shiny interface, for example random_ggplot() will be used with a renderPlot() and plotOutput(). And as we want to prototype but still be close to what your final application will look like, these functions take arguments that can shape the output: for example, random_ggplot() has a type parameter that can help you select a specific geom.
library(shiny)
library(shinipsum)
library(DT)
ui <- fluidPage(
  h2("A Random DT"),
  DTOutput("data_table"),
  h2("A Random Plot"),
  plotOutput("plot"),
  h2("A Random Text"),
  tableOutput("text")
)

server <- function(input, output, session) {
  output$data_table <- DT::renderDT({
    random_DT(5, 5)
  })
  output$plot <- renderPlot({
    random_ggplot(type = "point")
  })
  output$text <- renderText({
    random_text(nwords = 50)
  })
}
shinyApp(ui, server)
Other {shinipsum} functions include:
- tables:
random_table(nrow = 3, ncol = 10) Plant Type Treatment conc uptake Plant.1 Type.1 Treatment.1 conc.1
1 Qn1 Quebec nonchilled 95 16.0 Qn1 Quebec nonchilled 95
2 Qn1 Quebec nonchilled 175 30.4 Qn1 Quebec nonchilled 175
3 Qn1 Quebec nonchilled 250 34.8 Qn1 Quebec nonchilled 250
uptake.1
1 16.0
2 30.4
3 34.8- print outputs:
random_print(type = "model")
    Pearson's product-moment correlation

data:  datasets::mtcars$mpg and datasets::mtcars$cyl
t = -8.9197, df = 30, p-value = 6.113e-10
alternative hypothesis: true correlation is not equal to 0
95 percent confidence interval:
 -0.9257694 -0.7163171
sample estimates:
      cor
-0.852162
… and text, image, ggplotly, dygraph, and DT.
Learn more about {shinipsum}: